April 2026 in Baner — Air, Birds & Weather
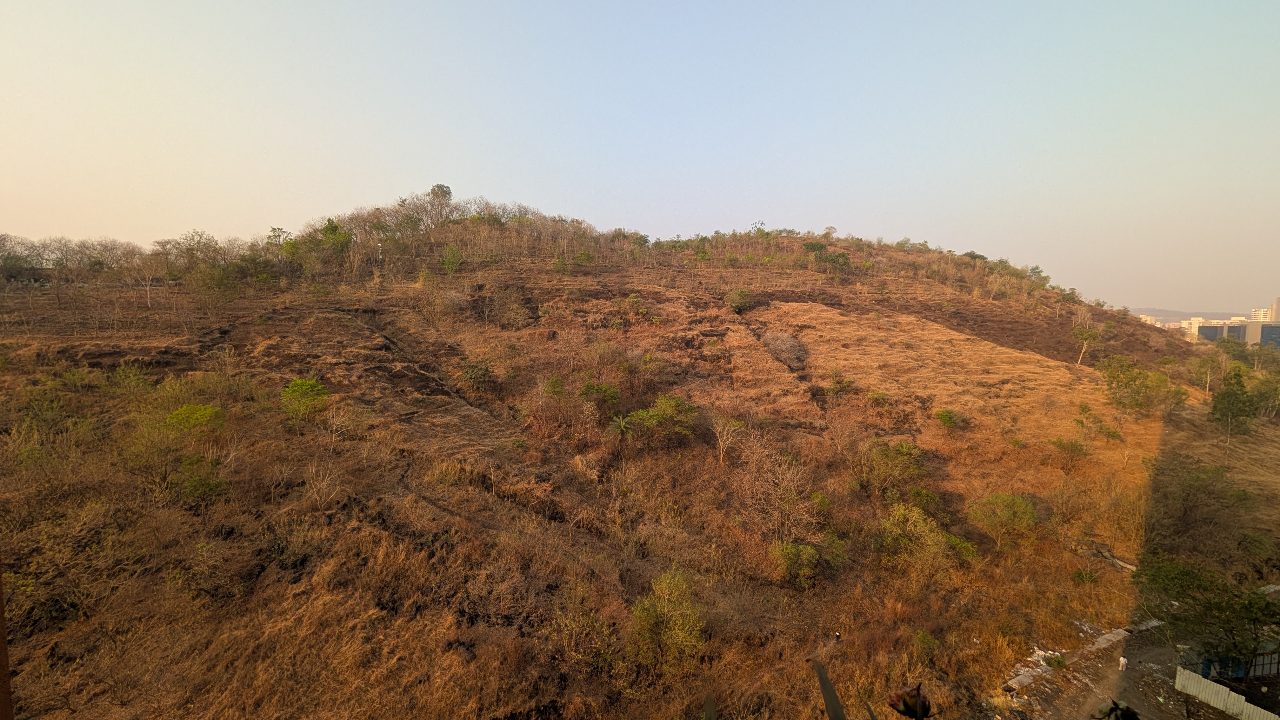
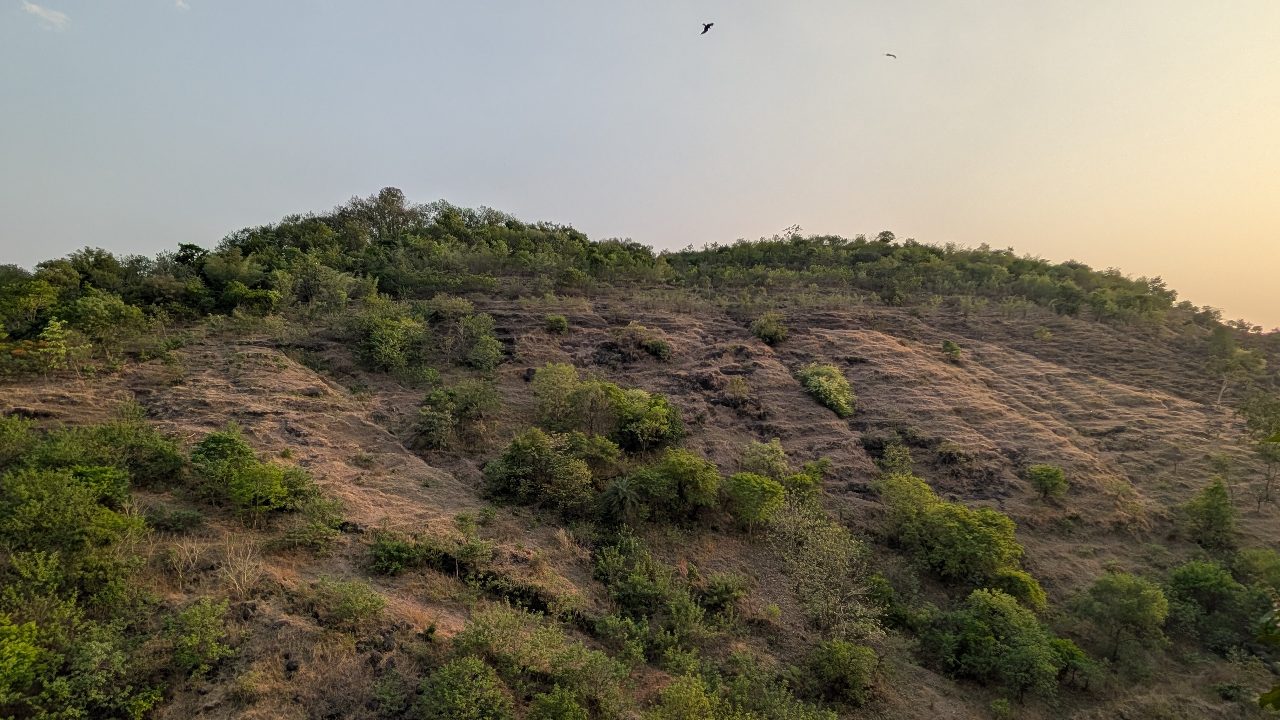
In , Baner (Pune) recorded an average EU AQI of 65.6 (cleaner than March 2026); temperatures from 19.6 to 41.5 °C; 37.8 mm of rain with 1 rainy day (2.5 mm or more) and 29 confirmed bird species from 1,458 BirdNET detections (confidence 0.70 or higher).
April 2026 at a glance (screenshot and share)
The month in numbers
Key facts: April 2026 in Baner, Pune
- Average AQI (EU scale)
- 65.6average of daily means; range 31-87; lower is cleaner
- Clean days (worst AQI 40 or below)
- 0of 30 complete days
- High-pollution days (worst AQI 61 or above)
- 29of 30 complete days
- Temperature range
- 19.6-41.5 °Caverage 30.7 °C (Baner Weather Union station readings)
- Rain
- 37.8 mm1 rainy days (2.5 mm or more); 3 days with 0.3 mm or more
- Average humidity
- 48%average of daily means
- Confirmed bird species (0.70 or higher)
- 291458 confirmed detections
- Candidate bird species (all detections)
- 9510981 detections including lower-confidence
- Peak bird hour (confirmed)
- 08:00 IST
- Most active confirmed species
- Asian Koel835 detections
- Soundscape (mean NDSI, 0-1)
- 0.378median 0.359; 129 valid readings
- Pulse Score
- 45composite of air, birds and clean days
Days run 00:00–24:00 IST. AQI is the European (EU) scale, 0–100, lower is cleaner. Bird headline numbers count detections at confidence 0.70 or higher ("confirmed").
Moderate month for Baner
April 2026 saw a notable improvement in air quality compared to last year, with the average AQI being cleaner by 1 point. Temperatures were warmer across the board, with an average increase of 1.4°C compared to April 2025.
This April at Earth Pulse in Baner brought a cleaner air quality average of 65.6 compared to March's 68.1. The air was hazier than in April 2025, with an AQI average of 65.6 versus 66.6. However, the average temperature was warmer, reaching 30.7°C, a rise of 1.4°C from April 2025. Rainfall was significantly higher, with 37.8mm recorded on 1 rainy day, a substantial increase from the 8mm over 1 rainy day in April 2025. Birdsong was much more active, with 29 confirmed species detected, a significant rise from 5 species in March. This April also saw more confirmed detections, 1458, compared to 6 in March. The Pulse Score increased from 13 to 45. Temperature and rain for 2025 are Open-Meteo model estimates, while 2026 uses the Baner station, so these comparisons are not a trend.
Month on month
Compared with March 2026
April 2026 against March 2026. Red = worse for air or wildlife, green = better; rain is shown without a colour judgement. Both months use the same source (Baner station).
Year on year · same month
Same month last year: April 2025
Sources for temperature and rain: 2026: Baner Weather Union station readings; 2025: Open-Meteo model estimates. Air quality uses the same EU AQI source in both years.
Caution: 2025 temperature and rain are Open-Meteo model estimates; 2026 values are Baner Weather Union station readings. Direction is shown but this mixes a model with a station and is not a trend.
The long view · ERA5 reanalysis (a model, not a station)
ERA5 reanalysis, 1980–2021, 42 years: April in context
ERA5 is a reanalysis model (Copernicus / ECMWF), not a station. It is shown beside, and never subtracted from, Open-Meteo or station values. The bias-free signal is ERA5 compared with ERA5 (early 1981-90 vs recent 2012-21).
- Warmest: 2009 (29.58 °C mean)
- Coolest: 1997 (26.4 °C mean)
- Wettest: 1991 (28.3 mm)
- Driest: 1990 (0 mm)
Shown beside ERA5, not subtracted from it. A station near the city and a 30 km reanalysis grid measure different things, so the gap between them is not a warming figure. The bias-free change is ERA5 against itself, above.
Air · European AQI, 0–100
Air quality — April 2026
| Mon | Tue | Wed | Thu | Fri | Sat | Sun |
|---|---|---|---|---|---|---|
| 166 high-pollution day | 269 high-pollution day | 373 high-pollution day | 467 high-pollution day | 562 high-pollution day | ||
| 659 high-pollution day | 757 high-pollution day | 864 high-pollution day | 970 high-pollution day | 1082 high-pollution day | 1174 high-pollution day | 1276 high-pollution day |
| 1369 high-pollution day | 1466 high-pollution day | 1561 high-pollution day | 1657 high-pollution day | 1765 high-pollution day | 1869 high-pollution day | 1968 high-pollution day |
| 2072 high-pollution day | 2172 high-pollution day | 2271 high-pollution day | 2373 high-pollution day | 2472 high-pollution day | 2571 high-pollution day | 2666 high-pollution day |
| 2754 high-pollution day | 2858 high-pollution day | 2951 high-pollution day | 3037 |
Weather · Baner station
Temperature & rain — Baner, Pune
Show the numbers
| Day | Low °C | High °C |
|---|---|---|
| 1 April 2026 | 24 | 36.1 |
| 2 April 2026 | 19.6 | 34.5 |
| 3 April 2026 | 20.8 | 33.9 |
| 4 April 2026 | 21.3 | 34.3 |
| 5 April 2026 | 22.1 | 33.4 |
| 6 April 2026 | 20.3 | 33.2 |
| 7 April 2026 | 21 | 35.6 |
| 8 April 2026 | 22.6 | 34.8 |
| 9 April 2026 | 22.9 | 34.1 |
| 10 April 2026 | 22.6 | 37 |
| 11 April 2026 | 24.9 | 40.6 |
| 12 April 2026 | 25.2 | 40.2 |
| 13 April 2026 | 26 | 39.3 |
| 14 April 2026 | 24.8 | 40.7 |
| 15 April 2026 | 26.2 | 39.7 |
| 16 April 2026 | 24.5 | 39.3 |
| 17 April 2026 | 24.2 | 40.5 |
| 18 April 2026 | 26.3 | 38.8 |
| 19 April 2026 | 27.3 | 41.5 |
| 20 April 2026 | 25.8 | 39 |
| 21 April 2026 | 27.1 | 40.8 |
| 22 April 2026 | 27.7 | 39.7 |
| 23 April 2026 | 26.6 | 40.9 |
| 24 April 2026 | 28.4 | 40.8 |
| 25 April 2026 | 28.6 | 40.2 |
| 26 April 2026 | 28.4 | 41.5 |
| 27 April 2026 | 25.8 | 40.1 |
| 28 April 2026 | 26.2 | 40 |
| 29 April 2026 | 25.5 | 39.9 |
| 30 April 2026 | 25.8 | 37.1 |
Show the numbers
| Day | Rain mm |
|---|---|
| 1 April 2026 | 0 |
| 2 April 2026 | 36.2 |
| 3 April 2026 | 0 |
| 4 April 2026 | 0 |
| 5 April 2026 | 0.4 |
| 6 April 2026 | 0 |
| 7 April 2026 | 0 |
| 8 April 2026 | 0 |
| 9 April 2026 | 0 |
| 10 April 2026 | 0 |
| 11 April 2026 | 0 |
| 12 April 2026 | 0 |
| 13 April 2026 | 0 |
| 14 April 2026 | 0 |
| 15 April 2026 | 0 |
| 16 April 2026 | 0 |
| 17 April 2026 | 0 |
| 18 April 2026 | 0 |
| 19 April 2026 | 0 |
| 20 April 2026 | 0 |
| 21 April 2026 | 0 |
| 22 April 2026 | 1 |
| 23 April 2026 | 0 |
| 24 April 2026 | 0.2 |
| 25 April 2026 | 0 |
| 26 April 2026 | 0 |
| 27 April 2026 | 0 |
| 28 April 2026 | 0 |
| 29 April 2026 | 0 |
| 30 April 2026 | 0 |
Birds · BirdNET acoustic AI · confirmed = 0.70 or higher
Birds of April — Baner Hill
Show the numbers
| Hour (IST) | Confirmed detections |
|---|---|
| 00:00 | 1 |
| 01:00 | 5 |
| 02:00 | 5 |
| 03:00 | 10 |
| 04:00 | 12 |
| 05:00 | 72 |
| 06:00 | 105 |
| 07:00 | 293 |
| 08:00 | 391 |
| 09:00 | 115 |
| 10:00 | 2 |
| 11:00 | 3 |
| 12:00 | 0 |
| 13:00 | 9 |
| 14:00 | 0 |
| 15:00 | 0 |
| 16:00 | 0 |
| 17:00 | 45 |
| 18:00 | 223 |
| 19:00 | 130 |
| 20:00 | 0 |
| 21:00 | 12 |
| 22:00 | 9 |
| 23:00 | 16 |
| Confidence | Detections | Species |
|---|---|---|
| ≥ 0.70 · confirmed (headline) | 1,458 | 29 |
| ≥ 0.50 | 3,145 | 45 |
| ≥ 0.30 | 5,913 | 63 |
| All recorded (≥ 0.15) · candidates | 10,981 | 95 |
BirdNET gives every detection a confidence score. Earth Pulse counts only detections at 0.70 or higher as confirmed; lower tiers are shown for transparency and include false positives.
Top 10 confirmed species this month
- #1Asian KoelEudynamys scolopaceus835 (60%)

©
Photo: Challiyan, via Wikimedia Commons · CC BY-SA 4.0 - #2Red-wattled LapwingVanellus indicus338 (24%)

©
Photo: Shantanu Kuveskar, via Wikimedia Commons · CC BY-SA 4.0 - #3Gray FrancolinOrtygornis pondicerianus80 (6%)

©
Photo: Tisha Mukherjee, via Wikimedia Commons · CC BY-SA 4.0 - #4Ashy PriniaPrinia socialis39 (3%)

©
Photo: Tisha Mukherjee, via Wikimedia Commons · CC BY-SA 4.0 - #5Black-crowned Night-HeronNycticorax nycticorax28 (2%)

©
Photo: ramidos, via Wikimedia Commons · CC BY 4.0 - #6OspreyPandion haliaetus27 (2%)

©
Photo: Chuck Homler / Focus On Wildlife, via Wikimedia Commons · CC BY-SA 4.0 - #7Tree PipitAnthus trivialis19 (1%)

©
Photo: Imran Shah from Islamabad, Pakistan, via Wikimedia Commons · CC BY-SA 2.0 - #8Large-billed CrowCorvus macrorhynchos13 (1%)

©
Photo: Laitche, via Wikimedia Commons · CC BY-SA 4.0 - #9ShikraAccipiter badius12 (1%)

©
Photo: Ravi Vaidyanathan, via Wikimedia Commons · CC BY 2.5 - #10Green SandpiperTringa ochropus9 (1%)

©
Photo: Swardeepak, via Wikimedia Commons · CC BY-SA 4.0
Birds · who rose, who fell
Species momentum vs March 2026
Confirmed detections (confidence 0.70 or higher), this month vs last month. Rule: up or down = change of 25% or more AND at least 5 detections; otherwise stable. Bars: last month (light) and this month (dark), per bird.
More active (2)
- Tree PipitAnthus trivialis2 → 19 (+850%)
©
Photo: Imran Shah from Islamabad, Pakistan, via Wikimedia Commons · CC BY-SA 2.0 - Large-billed CrowCorvus macrorhynchos1 → 13 (+1,200%)
©
Photo: Laitche, via Wikimedia Commons · CC BY-SA 4.0
Less active (0)
None this month.
Heard this month, not last month (25)Asian Koel, Red-wattled Lapwing, Gray Francolin, Ashy Prinia …
- Asian KoelEudynamys scolopaceus835 this month · not heard last month
©
Photo: Challiyan, via Wikimedia Commons · CC BY-SA 4.0 - Red-wattled LapwingVanellus indicus338 this month · not heard last month
©
Photo: Shantanu Kuveskar, via Wikimedia Commons · CC BY-SA 4.0 - Gray FrancolinOrtygornis pondicerianus80 this month · not heard last month
©
Photo: Tisha Mukherjee, via Wikimedia Commons · CC BY-SA 4.0 - Ashy PriniaPrinia socialis39 this month · not heard last month
©
Photo: Tisha Mukherjee, via Wikimedia Commons · CC BY-SA 4.0 - Black-crowned Night-HeronNycticorax nycticorax28 this month · not heard last month
©
Photo: ramidos, via Wikimedia Commons · CC BY 4.0 - OspreyPandion haliaetus27 this month · not heard last month
©
Photo: Chuck Homler / Focus On Wildlife, via Wikimedia Commons · CC BY-SA 4.0 - ShikraAccipiter badius12 this month · not heard last month
©
Photo: Ravi Vaidyanathan, via Wikimedia Commons · CC BY 2.5 - Green SandpiperTringa ochropus9 this month · not heard last month
©
Photo: Swardeepak, via Wikimedia Commons · CC BY-SA 4.0 - Indian RobinCopsychus fulicatus7 this month · not heard last month

©
Photo: Shino jacob koottanad, via Wikimedia Commons · CC BY-SA 4.0 - Common SandpiperActitis hypoleucos7 this month · not heard last month

©
Photo: JJ Harrison ( https://www.jjharrison.com.au/ ), via Wikimedia Commons · CC BY 3.0 - White-throated KingfisherHalcyon smyrnensis6 this month · not heard last month

©
Photo: Charles J. Sharp, via Wikimedia Commons · CC BY-SA 4.0 - Common MynaAcridotheres tristis5 this month · not heard last month

©
Photo: Gerrie van Vuuren, via Wikimedia Commons · CC BY-SA 4.0 - Eurasian CootFulica atra5 this month · not heard last month

©
Photo: Alexis Lours, via Wikimedia Commons · CC BY 4.0 - Eurasian MoorhenGallinula chloropus4 this month · not heard last month

©
Photo: Alexis Lours, via Wikimedia Commons · CC BY 4.0 - Red-vented BulbulPycnonotus cafer3 this month · not heard last month

©
Photo: Mahmadanesh, via Wikimedia Commons · CC BY 4.0
Showing 15 of 25.
Heard last month, not this month (1)Black-headed Gull
- Black-headed GullChroicocephalus ridibundus1 last month · none this month

©
Photo: Hans Hillewaert, via Wikimedia Commons · CC BY-SA 3.0
Stable (2)Rose-ringed Parakeet, Eurasian Kestrel
- Rose-ringed ParakeetPsittacula krameri1 → 4 (+300%)

©
Photo: danielskatz, via Wikimedia Commons · CC BY 4.0 - Eurasian KestrelFalco tinnunculus1 → 1 (±0%)

©
Photo: Andreas Trepte, via Wikimedia Commons · CC BY-SA 2.5
"Not heard" means no confirmed detection (0.70 or higher) on the recorder, not that the bird left the hill. Rare birds with 1–2 detections move in and out of these lists by chance.
Soundscape · NDSI
Soundscape health
NDSI 0 to 1; higher = more natural sound relative to human noise. Readings outside 0-1 are excluded as invalid.
Show the numbers
| Day | Mean NDSI | Readings |
|---|---|---|
| 24 April 2026 | 0.373 | 14 |
| 25 April 2026 | 0.371 | 14 |
| 26 April 2026 | 0.492 | 9 |
| 27 April 2026 | 0.329 | 13 |
| 28 April 2026 | 0.424 | 20 |
| 29 April 2026 | 0.371 | 30 |
| 30 April 2026 | 0.345 | 29 |
One recording node. 36% of raw readings were outside 0-1 and excluded.
The long view · one value per year
Every April since 1980
Two separate records, drawn on separate charts with separate axes: ERA5 reanalysis for 1980–2021, then Earth Pulse's own record for the last few years. They are never joined into one line.
1980–2021: ERA5 reanalysis
Show the numbers
| Year | Mean °C | Max °C (avg) | Min °C (avg) |
|---|---|---|---|
| 1980 | 29.43 | 37.5 | 22.28 |
| 1981 | 28.03 | 36.57 | 20.65 |
| 1982 | 27.13 | 35.55 | 20.23 |
| 1983 | 26.63 | 35.46 | 19.2 |
| 1984 | 28.51 | 36.85 | 21.4 |
| 1985 | 27.49 | 36.27 | 19.91 |
| 1986 | 28.56 | 37.46 | 21.11 |
| 1987 | 28.39 | 36.88 | 21.25 |
| 1988 | 28.45 | 36.52 | 21.78 |
| 1989 | 28.14 | 36.51 | 20.72 |
| 1990 | 27.59 | 36.73 | 19.63 |
| 1991 | 27.62 | 35.44 | 20.85 |
| 1992 | 28.21 | 36.51 | 20.87 |
| 1993 | 27.7 | 36.12 | 20.08 |
| 1994 | 26.97 | 34.69 | 20.13 |
| 1995 | 28.32 | 36.29 | 21.18 |
| 1996 | 27.53 | 35.92 | 20.47 |
| 1997 | 26.4 | 34.17 | 19.75 |
| 1998 | 28.75 | 36.97 | 21.57 |
| 1999 | 27.68 | 36.15 | 20.4 |
| 2000 | 28.01 | 36.43 | 21.07 |
| 2001 | 28.57 | 36.37 | 21.65 |
| 2002 | 28.79 | 37.1 | 21.42 |
| 2003 | 28.73 | 36.8 | 21.84 |
| 2004 | 27.99 | 36.63 | 20.61 |
| 2005 | 28.67 | 36.91 | 21.3 |
| 2006 | 27.84 | 36.52 | 20.39 |
| 2007 | 28.85 | 37.2 | 21.72 |
| 2008 | 28.4 | 36.62 | 21.03 |
| 2009 | 29.58 | 37.58 | 22.23 |
| 2010 | 29.53 | 37.76 | 22.34 |
| 2011 | 28.05 | 36.22 | 20.78 |
| 2012 | 28.56 | 37.18 | 21.22 |
| 2013 | 27.9 | 36.73 | 20.15 |
| 2014 | 28.89 | 37.1 | 21.52 |
| 2015 | 27.21 | 35.25 | 20.57 |
| 2016 | 29.05 | 37.63 | 21.94 |
| 2017 | 27.95 | 36.66 | 20.37 |
| 2018 | 27.86 | 36.57 | 20.57 |
| 2019 | 28.66 | 37.55 | 21.01 |
| 2020 | 28.72 | 36.99 | 21.49 |
| 2021 | 27.96 | 36.12 | 20.73 |
Show the numbers
| Year | Rain mm | Rainy days |
|---|---|---|
| 1980 | 12.8 | 1 |
| 1981 | 7.2 | 0 |
| 1982 | 7.1 | 1 |
| 1983 | 0.5 | 0 |
| 1984 | 1.2 | 0 |
| 1985 | 4.4 | 1 |
| 1986 | 6 | 1 |
| 1987 | 4 | 0 |
| 1988 | 24.1 | 2 |
| 1989 | 6.4 | 0 |
| 1990 | 0 | 0 |
| 1991 | 28.3 | 5 |
| 1992 | 0.5 | 0 |
| 1993 | 7.7 | 2 |
| 1994 | 17.9 | 3 |
| 1995 | 12.2 | 0 |
| 1996 | 11.6 | 2 |
| 1997 | 18.4 | 2 |
| 1998 | 3 | 0 |
| 1999 | 1.8 | 0 |
| 2000 | 5.1 | 0 |
| 2001 | 1.5 | 0 |
| 2002 | 16.4 | 2 |
| 2003 | 9.8 | 2 |
| 2004 | 1.3 | 0 |
| 2005 | 21.6 | 2 |
| 2006 | 1.3 | 0 |
| 2007 | 17 | 1 |
| 2008 | 10.2 | 2 |
| 2009 | 0.3 | 0 |
| 2010 | 12.6 | 1 |
| 2011 | 9.9 | 1 |
| 2012 | 14.7 | 2 |
| 2013 | 3.2 | 1 |
| 2014 | 14.3 | 1 |
| 2015 | 11 | 2 |
| 2016 | 11.2 | 2 |
| 2017 | 0.2 | 0 |
| 2018 | 7.4 | 1 |
| 2019 | 0.8 | 0 |
| 2020 | 0.8 | 0 |
| 2021 | 1 | 0 |
Recent years: Earth Pulse record
Open-Meteo model before 10 Oct 2025, Baner Weather Union station from 10 Oct 2025 (see the source on each row)
Show the numbers
| Year | Source | Average °C | Lowest °C | Highest °C |
|---|---|---|---|---|
| 2022 | Open-Meteo model | 29.6 | 19.1 | 41 |
| 2023 | Open-Meteo model | 27.2 | 16 | 37.5 |
| 2024 | Open-Meteo model | 30.4 | 18.5 | 41 |
| 2025 | Open-Meteo model | 29.3 | 18.8 | 41.6 |
| 2026 | Baner station | 30.7 | 19.6 | 41.5 |
Show the numbers
| Year | Source | Rain mm | Rainy days |
|---|---|---|---|
| 2022 | Open-Meteo model | 0.2 | 0 |
| 2023 | Open-Meteo model | 6.6 | 0 |
| 2024 | Open-Meteo model | 1.2 | 0 |
| 2025 | Open-Meteo model | 8 | 1 |
| 2026 | Baner station | 37.8 | 1 |
Air quality, same month, last 5 years
| Year | Avg AQI | Range | Clean days (≤ 40) | High days (≥ 61) | Complete days |
|---|---|---|---|---|---|
| 2026 ★ | 65.6 | 31–87 | 0 | 29 | 30 |
| 2025 | 66.6 | 39–107 | 0 | 29 | 30 |
| 2024 | 65.1 | 37–78 | 0 | 30 | 30 |
| 2023 | 69.4 | 36–94 | 0 | 30 | 30 |
| 2022 | — | —–— | 0 | 0 | 30 |
EU AQI, lower = cleaner. Daily cache (ep_daily_climate). aqi_avg is the average of daily means. Clean day = the day's worst hour stayed at EU AQI 40 or below; high-pollution day = the worst hour reached 61 or more. Bar: share of clean days (green) and high-pollution days (red).
Records
Records and ranks
Days that stood out in April 2026
- Hottest day: 19 April 2026, 41.5 °C
- Coolest night: 2 April 2026, 19.6 °C
- Rainiest day: 2 April 2026, 36.2 mm
- Cleanest air: 30 April 2026, daily-average EU AQI 37.1
- Haziest air: 10 April 2026, daily-average EU AQI 81.5
How this April ranks
- Average AQI: the 2nd lowest (cleanest) of 4 Aprils held by Earth Pulse.
Temperature and rain are not ranked: earlier years come from a different source (Open-Meteo model vs station).
Same calendar month across the sensor years held (up to the last 4 years plus this one). Rank 1 = lowest value. ERA5 is never ranked together with these.
On ERA5 (a separate record, 1980–2021) the warmest April was 2009 and the wettest 1991. ERA5 is never ranked together with Earth Pulse values.
Looking ahead · not a forecast
What a typical May looks like
ERA5 reanalysis normal 1981-2010 for the coming month. A long-term average, not a forecast. ERA5 runs cooler than a station near the city, so read these as the shape of the season rather than a number to expect on the Baner gauge.
Questions people ask
April 2026 in Baner: frequently asked questions
What was the air quality in Baner, Pune in April 2026?
The average EU AQI in Baner in April 2026 was 65.6 (range 31–87; lower is cleaner), cleaner than March 2026 (68.1). 0 of 30 complete days were clean-air days, meaning the worst hour stayed at EU AQI 40 or below, and 29 were high-pollution days (worst hour 61 or more). Counting daily averages instead, 3% of days averaged EU AQI 40 or below.
How much rain fell in Baner in April 2026?
Baner received 37.8 mm of rain in April 2026 (Baner Weather Union station), wetter than March 2026 (32 mm). 1 day was a rainy day under the IMD rule of 2.5 mm or more in an IST day; 3 days had at least 0.3 mm. The wettest day was 2 April 2026 with 36.2 mm.
How hot was Baner in April 2026?
Temperatures in Baner ranged from 19.6 °C to 41.5 °C in April 2026, with a monthly average of 30.7 °C (Baner Weather Union station). That was warmer than March 2026 (29.2 °C); the hottest day was 19 April 2026 at 41.5 °C. April 2025 averaged 29.3 °C, but that value is an Open-Meteo model estimate, so the year-on-year gap is not a trend.
Which birds were heard on Baner Hill in April 2026?
BirdNET confirmed 29 bird species from 1,458 detections at confidence 0.70 or higher on Baner Hill in April 2026. The most active confirmed species was the Asian Koel (835 detections), and birds called most at 08:00 IST. Counting every recorded detection, including lower-confidence candidates, there were 95 candidate species in 10,981 detections.
How natural did Baner Hill sound in April 2026?
The mean soundscape index (NDSI, 0 to 1; higher means more natural sound relative to human noise) was 0.378 in April 2026, with a median of 0.359 from 129 valid readings.
How does April 2026 compare with the long-term climate in Baner?
On ERA5 reanalysis (Copernicus / ECMWF), the 1981–2010 normal for April in the Baner grid cell is 28.1 °C with 8.6 mm of rain. Compared with itself, ERA5 changed by +0.39 °C between 1981–90 and 2012–21. ERA5 is a 30 km model grid, so it is shown beside this month's readings (30.7 °C, 37.8 mm), not subtracted from them.
Week by week
Weekly reports for April 2026
Methods & definitions
How this report was made
Definitions
- Rainy day: 2.5 mm or more of rain in the IST calendar day (India Meteorological Department). Less than 0.3 mm is a trace and counts as dry. The month's rain total still adds up every drop.
- Clean-air day: the day's worst hour stayed at European AQI 40 or below. High-pollution day: the worst hour reached EU AQI 61 or more. Only days with at least 18 hourly readings count.
- Confirmed bird: a BirdNET detection with confidence 0.70 or higher. Tiers (0.70, 0.50, 0.30, 0.15) are nested: each includes the higher ones.
- Species momentum: "more" or "less active" needs a change of at least 25% and at least 5 detections; otherwise "stable".
- Soundscape (NDSI): readings outside 0–1 are calibration errors and are dropped; a change in the monthly mean smaller than 0.02 is "similar".
- Model vs station: temperature and rain before 10 Oct 2025 are Open-Meteo model estimates; from then on they are Baner Weather Union station readings. ERA5 is a third, separate record.
Sources
- Air quality, temperature, humidity and rain: Earth Pulse daily cache (ep_daily_climate). Temperature and rain are Open-Meteo model estimates before 10 Oct 2025 and Baner Weather Union station readings from then.
- Birds: BirdNET acoustic AI on the Baner Hill node. Monitoring began in March 2026; earlier months have no bird data. Headline numbers count detections at confidence 0.70 or higher; lower tiers are nested.
- Soundscape: NDSI readings from the Baner Hill node, keeping 0 to 1 only.
- Long-term context: ERA5 reanalysis (Copernicus / ECMWF), 1980-2021, 42 years. A model, not a station; compared only with itself.
Notes
- The share of clean days uses the daily-average AQI (EU scale). Older posts counted the share of hours.
- Hottest, coolest and rainiest days come from the daily cache and can differ by rounding from hourly readings.
- Pulse Score = 0.4 x (100 - average AQI) + 0.3 x min(100, confirmed detections / 8) + 0.3 x share of clean days.
ERA5: contains modified Copernicus Climate Change Service information (1980-2021). Neither the European Commission nor ECMWF is responsible for any use of it.
Time zone: Asia/Kolkata (IST); a month runs from 00:00 IST on the 1st to 00:00 IST on the 1st of the next month. Figures computed by the Earth Pulse Worker (data 2026.10.06-r3-monthly-seo); the written story is generated by AI from those figures only.
Reuse
Cite this page
Earth Pulse (2026). April 2026 in Baner — Air, Birds & Weather. Earth Pulse monthly report, Baner, Pune, India. Published 6 October 2026. https://www.earth-pulse.org/blog/2026/april.html
Data are citizen-science observations from one site; please cite the page and state the source labels (station, Open-Meteo model, ERA5) when you reuse a number.
Licence: Earth Pulse's own observations on this page are shared under CC BY-NC 4.0 (credit Earth Pulse; no commercial use without permission). ERA5 values contain modified Copernicus Climate Change Service information; Open-Meteo and Weather Union data keep their own terms.
🌿 Get monthly reports in your inbox
One email on the 1st of every month. Baner's environmental story, delivered.
No spam. Unsubscribe anytime.